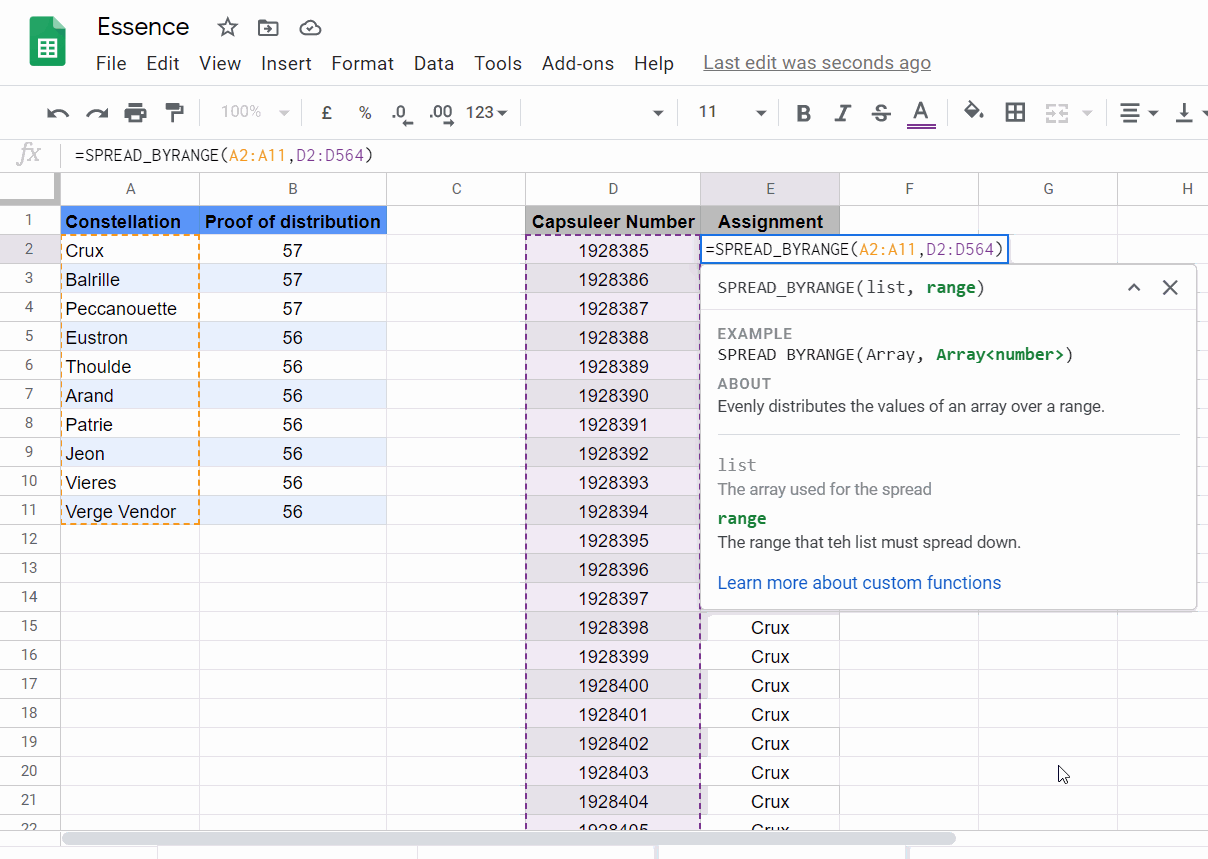
Pivot tables are a quick and powerful way to analyse data. Using Google Apps Script, there is an ability to build and modify pivot tables in Google Sheets. In this post I’ll share some tips and tricks for interacting with pivot tables in Google Sheets.
Here, I would like to report the process costs for searching values in Spreadsheet using Google Apps Script (GAS). When the values are searched in Google Spreadsheet, the following 3 patterns can be considered. Ref
Retrieve all values using getValues, and the values are searched from the retrieved array.
Use TextFinder.
Use Query language.
TextFinder is a relatively new addition to Google Apps Script with was released on April 5, 2019. TextFinder is part of the Spreadsheet Service and provides methods for finding or replacing text within a range, sheet or spreadsheet. There have been some reports on Stack Overflow that the TextFinder methods can be relatively slow to execute compared to using native JavaScript techniques. This post by Tanaike explores the process time of TextFinder against other techniques. Click through to the source for the results and code for running the experiment.
This is a Google Apps Script library for supporting Document service, Docs API, Spreadsheet service, Sheets API, Slides service and Slides API. The aim of this library is to compensate the processes that they services cannot achieve.
The purpose of this contribution from Tanaike is to extend Google Apps Script to interact with certain types of Google Drive files using methods not included in the existing core or advanced services. Features worth noting are:
Google Docs:
Retrieve table width and column width from the table. The tables inserted with the default width are included.
Google Sheets:
Retrieve all images in Google Spreadsheet as an object including the cell range and image blob.
Retrieve all comments in Google Spreadsheet as an object including the cell range and comments.
Insert images in cells of Google Spreadsheet using the image blob.
Create new Google Spreadsheet by setting the custom header and footer.
Microsoft Word:
Retrieve table width and column width.
Microsoft Excel:
Retrieve all values and formulas of the cells.
Retrieve all sheet names.
Retrieve all images as an object including the cell range and image blob.
Retrieve all comments as an object including the cell range and comments.
For more details about this library visit the source on Github
Google Sheets users can already use the magic of AutoFill to expand data automatically detecting a series of numbers, letters or dates. This feature is particularly powerful even when your series includes text or repeating dates. In this post I’ll highlight how you can also use AutoFill in your Google Apps Script projects
This post is designed for both no/low coders and expert developers interested in finding out how you can use AutoFill in your Google Sheets/Apps Script projects.
Did you know that you can send text messages via Google Sheets? In this episode of Sheets to Apps, we show you how to easily send text messages with Google Sheets via Twilio – an online communications provider.
Back in January Sourabh Choraria highlighted a Medium post from AVG showing how to Send SMS event updates or discount codes using Twilio from a Google Sheet. AVG has now created a short explanatory video covering this solution. You can view the video description for all the code and resources you need to try out this solution.
You can format the source data in Google Spreadsheet in different colors, fonts and sizes and all your cell formatting will be retained in the email messages.
Very handy code snippet from Amit Agarwal which lets you convert the formatted text in a Google Sheets cell to HTML. In the example Amit uses the formatted text in an email sent with MailApp but you might find other uses for this solution. Click through to the source link for all the details…
Back in 2015 I shared a post on Tips on emailing inline Google Charts from Sheets using Apps Script, which looked at how you can email charts from Google Sheets. This solution is one I use in my work on a daily basis and remains largely unchanged. More recently I was faced with the problem that I couldn’t include a Combo Chart. In this post I revisit this problem and share a solution for including copies of your Google Sheet charts in your email reports.
Whilst this solution focuses on extract Google Sheets chart images for the purpose of emailing, the technique might be of interest for other situations where you need to use a chart image.
Get stats for your current active sheet & the entire spreadsheet in one place using workbook statistics – a g suite editor add-on built using google apps script.
A handy Google Sheets add-on from Sourabh Choraria that can give you an Excel like summary of the Google Sheet you are working on that can display information like the number of: filled cells, formulas, charts and more. This post is also worth reading if you are interested in tips for the Add-on publication processes, highlighting some of the pitfalls you can avoid. The code for the Add-on is also open source making it possible to reuse in your own Apps Script projects.