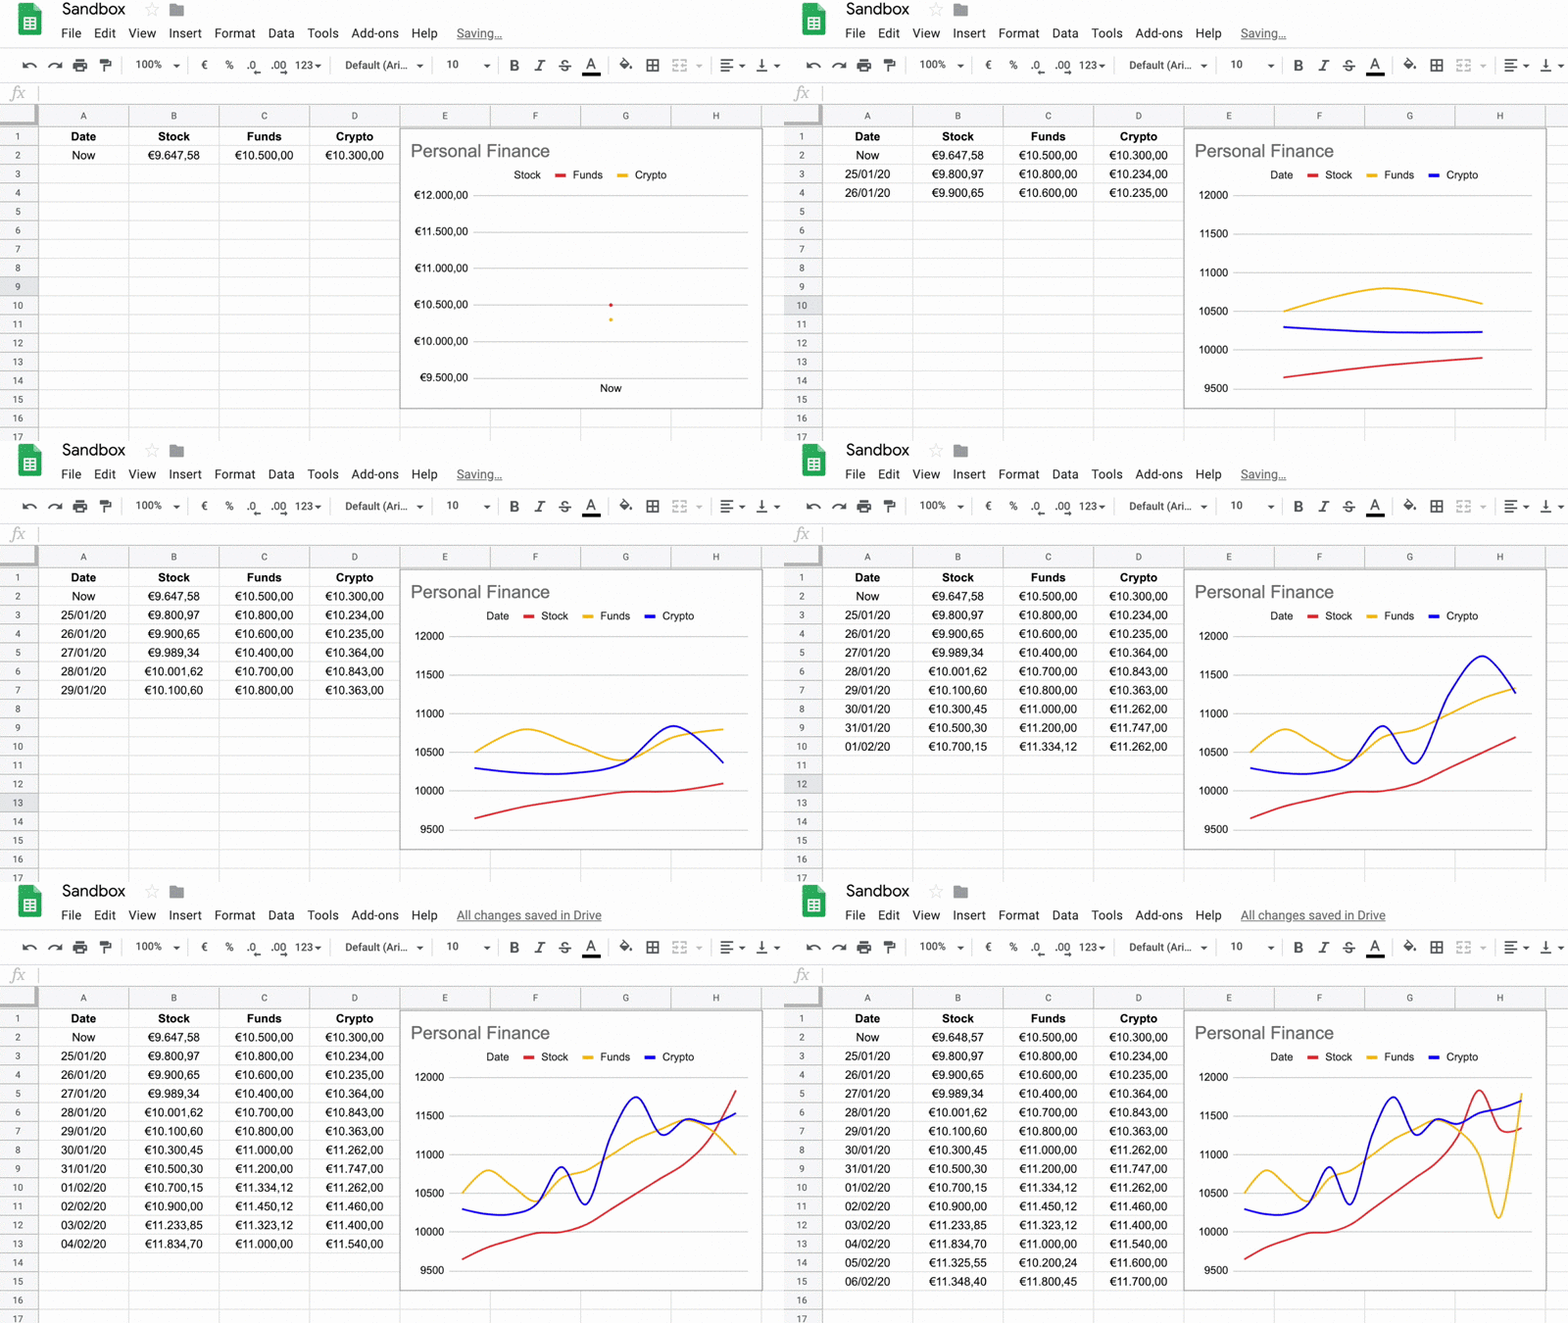
Based on an earlier article on how to live track our investment portfolio performance with Google Spreadsheets, it’s now time to automatically take snapshots in order to be able to visualize the evolution of it.
A short script that takes the current value of your portfolio and copies it into a new row while adding a timestamp – thus allowing the chart to visualize the data on a per-day basis.
Source: Trigger daily scripts to take snapshots and draw charts with Google Spreadsheets

