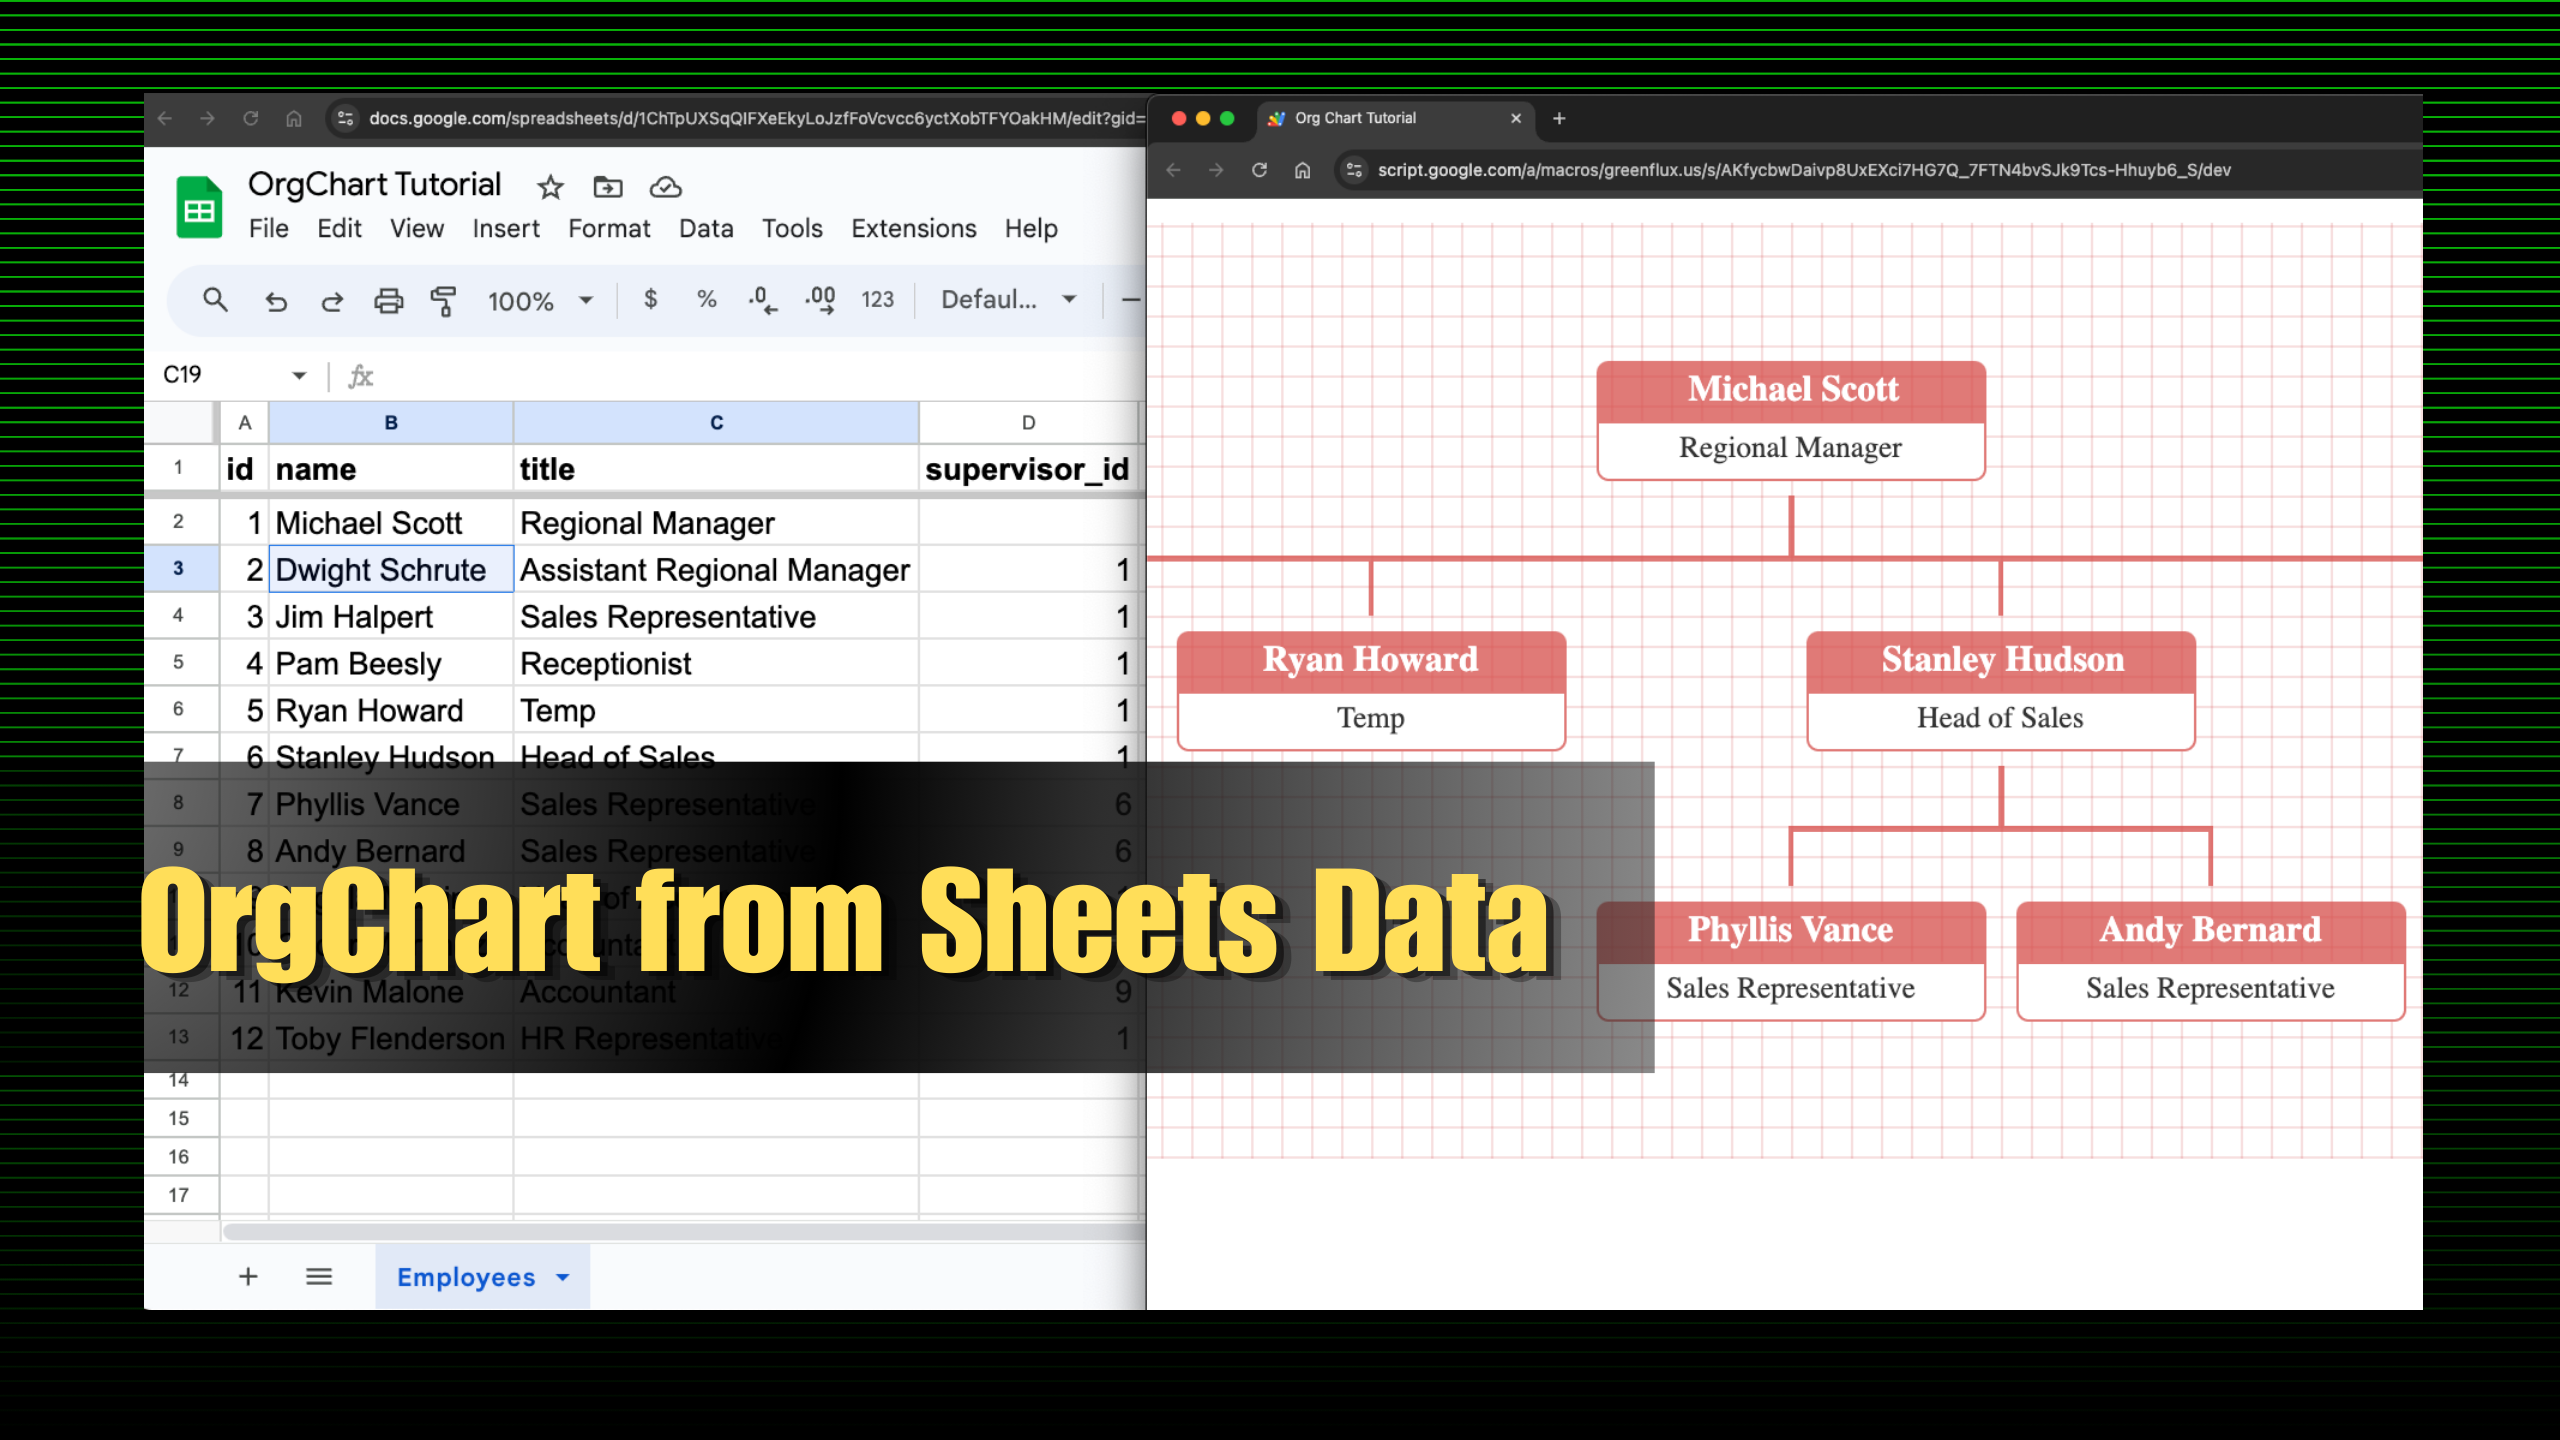
In this guide, I’ll show you how to build a data-driven organizational chart based on Google Sheets data, using Apps Script and the OrgChart JavaScript library.
Recently, I used Gemini Deep Reacher to “find the most popular or useful Google Apps Script tutorials?”. There was no mention of AppsScriptPulse (rude, but if you are curious, here is the report :), but it did introduce me to the work of Joseph Petty on the GreenFlux Blog.
One tutorial, in particular, stood out for its practical application for many organisations: “Building A Data-Driven Organisational Chart In Apps Script”.
Creating diagrams, particularly organisational charts, often requires laborious design work and manual revisions. Petty’s tutorial directly addresses this common frustration by demonstrating how Google Sheets, Apps Script, and the OrgChart JavaScript library can produce dynamic, data-driven organisational charts that automatically stay current.
The Core Idea: From Spreadsheet Data to Visual Chart
The beauty of this approach lies in its simplicity and efficiency. Most organisations already maintain employee data, including supervisor information, in spreadsheets or databases. Petty’s method cleverly taps into this existing data source.
The tutorial guides you through several key steps:
- Foundation Setup: Deploy a basic Apps Script web app, creating an
index.htmlfor the frontend andCode.gsfor server-side logic (including adoGet()function). - OrgChart Library Integration: Introduce the open-source OrgChart JavaScript library, which uses a nested JSON structure to define the visual hierarchy.
- Data Transformation: Write an Apps Script function (
getEmployeeData) to pull data from Google Sheets (employee IDs, names, titles, supervisor IDs) and convert it into the required nested JSON format for the chart. - Dynamic Connection: Pass the generated JSON data from
Code.gsto the OrgChart library inindex.htmlusinggoogle.script.run.withSuccessHandler()to render the chart.
The Result? An Always Up-to-Date Org Chart
By following these steps, you can create an organisational chart that’s directly linked to your Google Sheet. When an employee changes roles, or a new team member joins, simply update the spreadsheet, and your web app will reflect these changes automatically. No more manual graphic updates!
For the complete code and detailed setup instructions, please follow the link to the original tutorial on GreenFlux Blog.
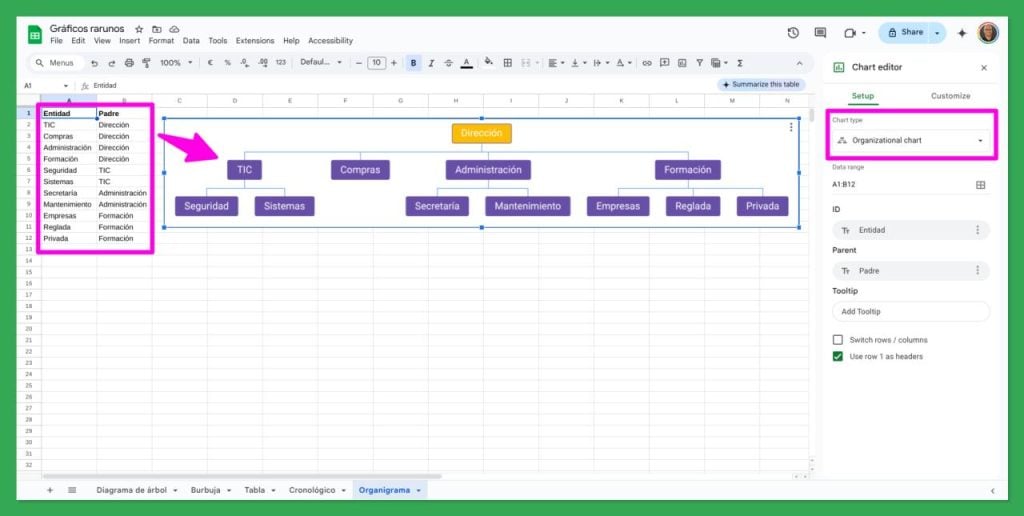
[Update 2025-05-16: A great tip from Pablo Felip Monferrer: “might be worth mentioning that the good old Sheets has a native organizational chart that can be easily published, too (hint: employee names in a third column can be displayed as tooltips)”.

Image credit: Pablo Felip Monferrer
Source: Building A Data-Driven Organizational Chart In Apps Script

Member of Google Developers Experts Program for Google Workspace (Google Apps Script) and interested in supporting Google Workspace Devs.
